Those who felt high levels of anxiety during this election season, myself included, often found themselves ritualistically refreshing FiveThirtyEight's election model to keep up with the latest election odds. However, unlike in previous election cycles, Nate Silver and his team's writing wasn't a source of reassurance for those hoping for a Democratic victory, as he and his model gave large probability of Trump winning the election (often hovering between 25% and 35%)
And as a result, Silver's predictions were the target of a large body of scrutiny and backlash, in particular because his model gave Trump the highest probability of winning among the most widely known predictions. At the time of the election, The New York Times' model, build by Nate Cohen, gave trump a 15% chance of winning, PredictWise a 10% chance, the Huffington Post only a 1% chance and the Princeton Election Consortium predicted that Trumps' chances were as low as 1%, stating that a Clinton victory was nearly certain.
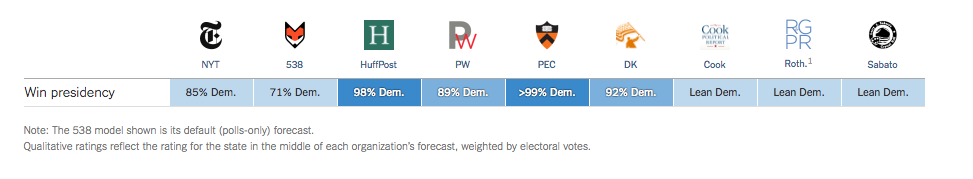
Even with Silver's relatively high odds, of these models predicted that Trump would win the election. And yet he did. So, what does that say about the state of election modeling? Were all these models wrong or somehow misguided? And how should we compare the predictions of these models, knowing that they were predicting an scenario that can only be run once? Politics aside, the art of modeling elections and the various approaches that were put forth during the 2016 season is a good subject for discussion important concepts in statistical modeling.
A model that was wrong can still be correect. The most important component of a model is properly modeling its errors. If, when building a model, you're not spending the majority of your time trying to understand errors and properly express the properties of those errors in your model, then your model's predicted probabilities are likely to be off.
In this case, a polling error would be one or more polls showing that the support of a candidate at X%, where the true rate (if you polled all people in a state/country simultaneously and got honest answers) is Y%. The trivial way that a poll can be wrong is due to limited statistics: if you poll a finite number of people, chosen randomly, there is uncertainty due to the sample you selected. Pretty much all polls and models include this error, as it's non-controversial.
The more nefarious types of errors are what are known as "systematic" errors. These are errors that come from the methodology of a poll or a model aggregating polls. A simple example would be if a poll only asked younger people who they wanted to vote for. No matter now many young people are asked, the answer obtained from a poll will differ from a poll that asks all people. These are the types of errors that are harder to understand and take into account in a model.
In addition to those systematic uncertainties, one must remember that an election is a human event. A model's uncertainties, either explicitly or indirectly, must take into account the probability of global events, news reports, weather, or a wide variety of other things that can change either individual's opinions or how likely they are to vote. I don't think any model should include these as specific variables, and perhaps they can be inferred from past election's polling errors, but they're certainly present. This fact makes me inherently skeptical of any model claiming a win rate nearing 99%.
Nate Silver, in discussing his model, consistently discussed the sources of systematic uncertainty in his predictions and how his model accounted for them. Specifically, he emphasized a few points:
- There is not a lot of past data to model the errors on presidential polls, making it difficult to know what the "tails" look like. Therefore, he chose a conservative distribution (a Student's-t distribution that gives a higher probability to larger polling errors than, say, a Gaussian distribution).
- Errors across states are correlated. In other words, if one state has a shift towards Trump, then other states are likely to have a shift of the same size (especially when they have similar demographics or economic conditions).
- Having a large number of "undecided" voters tends to increase model uncertainty
He described this often, including in the days before the election, when he said:
...it shouldn’t be hard to see how Clinton could lose. She’s up by about 3 percentage points nationally, and 3-point polling errors happen fairly often, including in the last two federal elections. Obama beat his polls by about 3 points in 2012, whereas Republicans beat their polls by 3 to 4 points in the 2014 midterms. If such an error were to favor Clinton, she could win in a borderline landslide. If the error favored Trump, however, she’d be in a dicey position, because the error is highly correlated across states.
There’s also reason to think a polling error is more likely than usual this year, because of the high number of undecided voters.
These points were the main drivers for why 538's model gave the highest chances of a Trump win. Blaming the polls for being wrong is not a sufficient excuse for a prediction being wrong. The whole point of a model is to properly model the polling errors! Aggregating polls and determining the overall statistical uncertainties is not sufficient, one needs to understand systematic errors to derive actual probabilities.
It's not clear that other models though through the modeling of errors in the same way. Sam Wang, just before the election, wrote this bizarre piece describing how he modeled polling errors:
To turn the Meta-Margin into a hard probability, I had to estimate the likely error on the Meta-Margin. For the home stretch, the likely-error formula in my code assumed an Election Eve error of 0.5% on average, following a t-distribution (parameter=3 d.f.).However, estimating it was an exercise in judgment, to put it mildly.
As you can see, a less aggressive approach to estimating the home-stretch error would have given a Clinton win probability of 91-93%. That is about as low as the PEC approach could ever plausibly get.
The impression that this discussion gives is that the modeling of theses errors was an afterthought that he assigned almost arbitrarily. This was made more troubling by his statement one how he determines the probabilities for individual states:
For each state, my code calculates a median and its standard error, which together give a probability.This quote suggests that he's relying on the standard distribution of the polling in an individual state to determine the error on the value and therefore the probability distribution of state outcomes. Doing so would only account for statistical errors and wouldn't take into account systematic errors, which are the most important ones in election modeling.
Even, if Silver's model did a better job than most of incorporating systematic sources of uncertainty, it predicted that the wrong person would win. Doesn't that mean that the model was wrong? No, not necessarily. Just as, if I were to call Heads on a coin that had a 55% chance of landing heads, and it landed tails, I would not have been wrong for believing that heads was the more likely outcome.
This is where much of the post-evection discussion of the models seems to be falling short. Getting the answer right is less important than properly modeling the distribution of various outcomes. Given that, is there a way to analyze which models did the best job at understanding the errors?
One way to evaluate a model is to calculate what's known as the Brier score. For multiple binary outcomes, this boils down to summing the squares of the probability of the outcome that DID NOT occur. So, for example, if you assign Clinton a probability of 99% and she wins, your Brier score will be 1%^2 = (0.01)^2 (lower Brier scores are better).
In the case of evaluating a national election model, a possible approach would be to calculate the Brier score for each model across all state outcomes. In other words, determine the probabilities that each model assigned to each state and determine the Brier score knowing the true outcome of that state.
But, that mythology is flawed. This assessment would not take into account the all-important correlations across states. If these correlations are true, then being slightly wrong in one state would lead to being slightly wrong in many states, leading to a higher Brier score on average.
A better would be to simply look at the likelihood of the actual outcome of the election given a model (or log-likelihood as most usually report). This would allow the full complexity of a model to be considered when comparing outcomes, including things like correlated errors.
Ultimately, the best way to evaluate a model is to consider what a model is being used for. The common saying "All models are wrong, some are useful" applies here. The value of a model is in how it's being used.
For example, if one were making bets based on the prediction of an election model, they may have lost a lot of money betting against Trump at nearly 100-1 odds. With that usage in mind , the likelihood would be a good measure of the value of a model. On the other hand, if one were allocating election resources based on a model (say, determining which in which states one should spend money), the cost function may be more complicated, as the overall probability would be less important than accurately understanding state-by-state odds and correlations. Or, if you were simply looking to a model for reassurance before election, then it's up to you to determine how optimistic or pessimistic you are willing to be.
Embracing uncertainty is the most important component of data literacy. Election models being wrong doesn't spell the end of political forecasting. It's simply a reminder that models are statistical and that expectations must embrace all possibilities, not just those that are the most likely.